
2023 Email Marketing Benchmark Report
See how your metrics compare to data from over 5 trillion emails.
Senders need to constantly refine their email strategy and strive to give their subscribers the best content they can to stand out in inboxes. Sometimes, this involves making sweeping changes, and other times, it means incremental improvements.
To assist you along this optimization journey, Twilio SendGrid analyzed email performance across messages sent via our platform between January and December 2022. Using data from over 5 trillion emails, we’ve gathered data to help you:
Understand your email program effectiveness by comparing your campaign metrics to those included in this report.
Identify where your program succeeds or where and how to improve it.
Create goals for next year and beyond to take your email program to the next level.
Here are our 2023 email marketing benchmarks and best practices for improving your key email metrics.
Open rate has always been a compelling engagement metric, helping senders gauge customer interest in their messages and understand which types of content recipients prefer. Since the launch of Apple’s Mail Privacy Protection in September 2021, open rate has become a less accurate but still important measure of engagement. While we now recommend senders look at open rate and click rate to achieve a full understanding of user engagement, here are our open rate benchmarks to help you understand how your email opens stack up:
19.09%
Average unique open rate
15.75%
Median unique open rate
Our data found that the average unique open rate across all industries was 19.09%, with a slightly lower median of 15.75%. Next, here’s a look at the quartile results for unique open rates:
Quartile unique open rate
|
25th percentile |
50th percentile |
75th percentile |
|---|---|---|
|
9.01% |
15.75% |
25.85% |
Knowing when to press send is somewhat of an art. Of course, results will vary by industry, email type, audience, and more, but here are a few high-level findings to help you find the perfect time to send out your next email campaign and drive opens.
Turns out, the early bird does not get the worm. We see the biggest drop in engagement between the hours of 2 a.m. to 6 a.m., so hold off on sending emails until your recipients have their morning coffee.
In fact, emails sent during normal business hours (between 9 a.m. and 6 p.m.) saw the highest unique opens, hovering between 44%-46% on average. Plus, recipients don’t seem to mind after-hours emails, although as send time increases, opens decrease.

Similar to our hourly findings, sending during the workweek seems to result in the highest engagement for senders, with Monday having the highest open rate of any weekday. Of course, take these results with a great deal of consideration, as SendGrid does have a large number of business-to-business (B2B) customers.
Look at your data to see which weekdays see the highest open rates:

Want to know how to improve your email open rates? Here are a few strategies to boost engagement:
Write irresistible subject lines: Your subject lines are often the first thing your recipients see in their inbox and play a significant role in their decision to open or delete a message. Make sure your subject lines are compelling and straightforward so your audience can quickly tell if a message is relevant to them.
Perform A/B tests: Testing your subject lines and preview text can help your business understand what messages resonate with your audiences and result in more opens.
Optimize the preview text: Preview text also plays a significant role in a recipient’s decision to open your email, so don’t write it off. Spend time crafting the perfect copy.
Segment your email list: Personalization generally results in higher engagement. Try segmenting your email lists to ensure your messages land in front of customers who find your messages relevant and valuable.
Check out our 9 strategies to increase email engagement blog post for more ways to improve email engagement metrics, like open rate, click rate, and more.
Click rate is an extremely strong indicator of engagement. Not only were your recipients interested enough by your email to open it, but they also clicked a link to find out more. So what is a good click rate for an email? Our data found emails have an average click rate of 4.48% and a median of 2.01%.
4.48%
Average click rate
2.01%
Median click rate
Like open rate, click rate is a metric that varies heavily based on factors like audience, industry, campaign, and more, so try to use your internal benchmark data to understand the success of your emails. Plus, not all campaigns drive clicks (think privacy policy updates, transactional emails, and more), so make sure you compare likes to likes when looking at your data.
Quartile unique click rate
|
25th percentile |
50th percentile |
75th percentile |
|---|---|---|
|
0.66% |
2.01% |
4.95% |
Need to improve your click through rates? Try some of these strategies:
Use a mobile-friendly email design: Many recipients view their email on the go, but poor mobile responsiveness can leave them to click “delete” rather than on your intended call to action (CTA). Make sure every email you send looks good on a mobile device.
Tell your story with engaging graphics: “A picture is worth a thousand words” holds true. Save your recipients from a wall of text by using fun, eye-catching graphics to tell your story and drive them to take action.
Include a prominent CTA: Make sure your CTA uses compelling language and pops visually on the page. That way, readers know exactly where to click to continue their journey.
Personalize email content: Customized content attracts more clicks. Use audience segmentation and customer data (like preferences, interests, job titles, and more) to create targeted content your recipients will want to click and engage with.
While senders want every email to end up in its intended recipient’s inbox, sometimes things go awry. Bounce rate measures the rate at which the server denies your messages based on factors like an invalid email address (hard bounce) or temporary server issues (soft bounce). The lower the bounce rate, the better, although we found most senders have an average bounce rate of around 1.06% and a median of 0.21%.
1.06%
Average bounce rate
0.21%
Median bounce rate
Quartile bounce rate
|
25th percentile |
50th percentile |
75th percentile |
|---|---|---|
|
0.07% |
0.21% |
0.61% |
When improving email bounce rates, focus on the overall health of your email list. Here are some proven must-haves to include:
Use double opt-in: After an individual signs up for your email list, send them an email with a CTA to confirm their subscription. This ensures they intended to sign up for your emails and entered their email address correctly.
Clean and maintain your email lists: Practicing good email hygiene regularly helps remove inactive or invalid email addresses from your subscriber list. This will improve your sender reputation and deliverability.
Verify email addresses: Improve deliverability by validating email addresses before you send with a tool like SendGrid’s Email Address Validation API. This will help you detect and suppress invalid email addresses quickly to reduce your bounce rate and improve delivery.
Monitor metrics: SendGrid’s Deliverability Insights dashboard lets you monitor and improve key metrics, like bounce rate, to identify issues, determine where to make improvements, and take action swiftly to improve email performance.
Block rate measures the rate at which your emails get temporarily filtered out by email service providers (ESPs). This could be because a sending IP or domain is on a deny list, the email content contains spam-marked elements, or the server has technical issues.
If your program sees a high number of blocked messages, this can indicate damage to your sending reputation. To help you assess whether your blocked rate is cause for concern, here are our block rate benchmarks:
2.93%
Average block rate
0.53%
Median block rate
Overall, we found a 2.93% average block rate across all industries, with a significantly lower median rate of 0.53%. Here are the quartile results to compare your rates against:
Quartile block rate
|
25th percentile |
50th percentile |
75th percentile |
|---|---|---|
|
0.18% |
0.53% |
1.55% |
Here’s how to improve your block rate:
Authenticate your emails: Implement Sender Policy Framework (SPF), DomainKeys Identified Mail (DKIM), and Domain-Based Message Authentication, Reporting and Conformance (DMARC) to prevent spoofing and improve deliverability.
Monitor deny lists: Ending up on a reputable deny list can hurt your domain’s email deliverability. To get delisted, reach out to the deny list company and prove that you’re a trustworthy sender. Just a few words of caution: Not all deny lists will impact your deliverability and never pay a fee to delist your IP address.
Use a reputable ESP: Reliable ESPs like SendGrid have strong relationships with inbox service providers (ISPs) and measures to monitor and improve deliverability. Partnering with the right solution can ensure your emails reach your intended recipients.
Avoid spam trigger words: ExCeSsIvE USE of CAPITAL letters, exclamation points (!!!!), attachments, and words like “free” or “urgent” can catch the attention of spam filters. Make sure you use clear, straightforward language to avoid getting your messages flagged. SendGrid’s email testing tool shows how your message content performs against the most powerful spam filters to help you catch issues before pressing send.
Every sender aims to send interesting and compelling messages their subscribers want to read, but not everyone will love every email you send. Spam complaint rate measures how frequently recipients tell their ESP they think a message is spam. At SendGrid, we recommend our clients keep spam complaint rates less than 0.08%, but surprisingly our benchmark findings were a bit higher than we expected.
0.25%
Median spam complaint rate
Our data found that the median spam complaint rate by user was 0.25%. Those who fell in the top 25th percentile for spam rate had an outstanding rate of 0%.
Quartile spam complaint by user
|
25th percentile |
50th percentile |
75th percentile |
|---|---|---|
|
0% |
0.25% |
0.87% |
Here’s what can you do to lower your spam rates:
Use the double opt-in method: After a user subscribes to your emails, send them an email to confirm their subscription. This ensures no one accidentally signs up and later marks your messages as spam when they don’t know why they receive them.
Don’t buy email lists: Let’s hear that one more time: Don’t buy email lists. Using purchased lists can negatively affect your sender reputation, lead to poor engagement, and land you on deny lists. Be sure to grow your list the old-fashioned way (with a tool like SendGrid sign-up forms) and ensure you have explicit consent from every recipient.
Use an email preference center: Using an email preference center can let your recipients select the types of messages they want to receive from your brand and the frequency. This gives them control over how your brand communicates with them and can lessen the likelihood they find your messages irrelevant and send them to the spam folder.
Use a clear sender name: You want recipients to be able to tell that a message comes from your brand in a matter of seconds. This can make them trust your email enough to open, click, and, more importantly, not mark it as spam. Plus, be sure to opt for clear email sender names to help them identify your brand quickly.
Leverage Brand Indicators for Message Identification (BIMI): BIMI attaches your brand’s logo to your messages, helping your recipients to recognize and trust the messages you send.
Now, we’ll shift gears a bit, and identify the busiest times of the year for email sending. Here’s a closer look at the email volume SendGrid processes by month, day, and hour by day to help you understand when your competitors send emails and when your company should too.
‘Tis the season for email. As a consumer yourself, you’ve probably noticed a big uptick in promotional emails near the end of the year. The holiday season is the biggest time of year for business-to-consumer (B2C) businesses trying to rake in sales and B2B businesses looking to convert customers with leftover budgets and close outstanding deals before year-end. So unsurprisingly, there’s a significant uptick in email messaging during November and December.
Conversely, January and February are the months with the lowest send volume. While we hope that’s because most email professionals are on a hard-earned break after the craziness of the holidays, this might also be because businesses are still solidifying goals, creating annual budgets, and strategizing for the year ahead.

When sending emails, any weekday is fair game. Our only piece of advice? Avoid weekends. We found that Saturday and Sunday had the lowest median processed emails of any day of the week. Since the weekends experience lower open rates, as we covered earlier in this report, this information isn’t a big surprise.
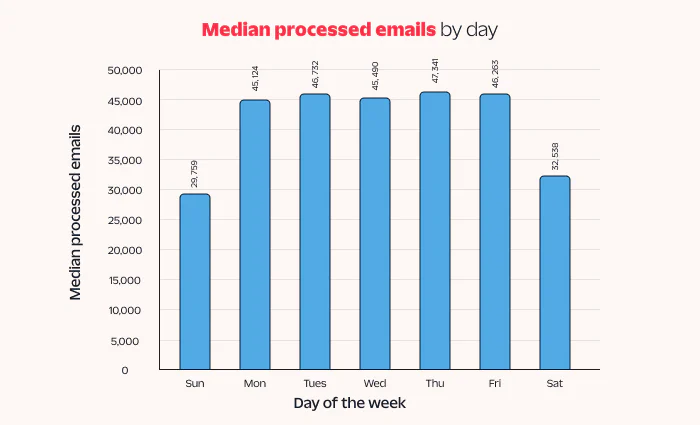
Quartile processed volume by day
|
Day |
25th percentile |
50th percentile |
75th percentile |
|---|---|---|---|
|
Monday |
26,703 |
45,104 |
66,016 |
|
Tuesday |
29,520 |
46,727 |
68,534 |
|
Wednesday |
29,259 |
45,482 |
66,933 |
|
Thursday |
29,540 |
47,386 |
69,454 |
|
Friday |
29,771 |
46,279 |
69,068 |
|
Saturday |
22,839 |
32,550 |
46,953 |
|
Sunday |
20,707 |
29,759 |
44,635 |
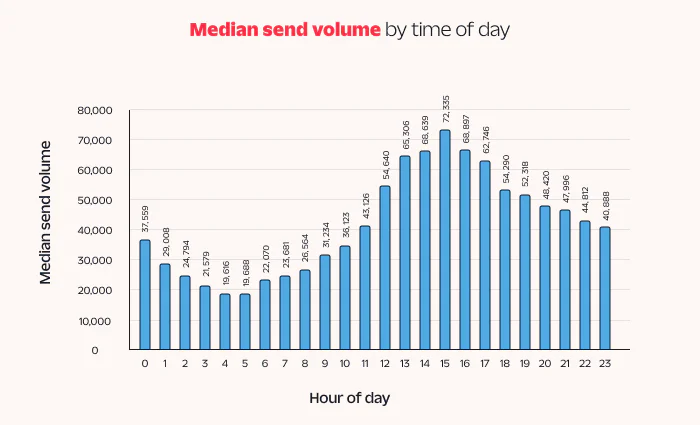
When looking at hourly sending across all weekdays, 3 p.m. appears to be the most popular time of day to send email. Most senders avoid the early morning hours, while sending usually picks up between noon and 4 p.m.
You might also wonder where recipients consume email. To help, we’ve tracked the total volume of messages SendGrid sent to the top 10 mailbox providers in Q4 2022.
Top 10 mailbox providers in Q4 2022
|
ISP |
Q4 processed email volume |
|---|---|
|
|
258,820,000,000 |
|
Yahoo |
60,802,000,000 |
|
Microsoft Outlook |
49,891,000,000 |
|
Microsoft 365 |
13,830,000,000 |
|
Apple iCloud |
12,803,000,000 |
|
Other |
11,278,000,000 |
|
Proofpoint |
4,671,530,812 |
|
AT&T |
3,551,861,495 |
|
Comcast |
3,228,969,179 |
|
Smarsh |
2,835,671,753 |
The top three most commonly used ISPs are Google, Yahoo, and Microsoft Outlook, making it essential to authenticate your email correctly to prevent your messages from getting blocked.
One of the great questions an email marketer must answer is: To share or not to share?
ISPs use your IP address to identify you as a sender, track sending behavior, and assign an IP reputation score. Email senders have two options to choose from: a shared IP address or a dedicated one. Here’s a quick look at each:
Shared IP address: A shared IP address, as its name suggests, is one you share with other senders. While sharing an IP address gives you less control over your IP reputation, it is a cost-effective way for smaller senders to start sending messages quickly.
Dedicated IP address: A dedicated IP, on the other hand, is used solely by your business, giving you more control over your sender reputation and deliverability. That said, dedicated IPs are pricier than shared IPs and need warming up before your business can send a high volume of messages.
Still not sure which type of IP address is right for your business? We looked back on the last two months of 2022 at senders with a minimum delivered volume of 1,000 to see how delivered, open, and block rates differ by IP address type. Here’s what we found:
Median delivered, open, and block rates by IP address type
|
IP address type |
Median delivered rate |
Median open rate |
Median block rate |
|---|---|---|---|
|
Dedicated IP |
96.01% |
39.99% |
0.87% |
|
Shared IP |
98.79% |
19.75% |
0.64% |
Dedicated IP addresses generally have higher deliverability. While senders with dedicated IP addresses generally have higher delivered rates because senders can better maintain their sender reputation, this wasn’t the case for SendGrid customers. Senders using dedicated IPs experienced a median delivered rate of 96%, while shared IP users came out on top with 99%.
Dedicated IP addresses have significantly higher open rates. Our senders using dedicated IPs experienced an average open rate of 40%, while shared IP users only saw 20%. We suspect that customers using dedicated IP addresses have more resources to invest in their email program and improve open rates.
Dedicated IP addresses have higher block rates. With a shared IP, you can blend in with the crowd, so your messages don’t get blocked as frequently. On the other hand, servers can block your message on a dedicated IP. We found shared IPs report an average block rate of 0.64%, while dedicated IPs land around 0.87%, just above SendGrid’s recommended range of <0.8%.
Is a dedicated IP address right for your company? Check out our blog post, Shared and dedicated IPs: Which should you choose?, for help weighing your options.
Reverse DNS (rDNS) allows mailbox providers to verify your sender domain has an IP address, allowing them to determine if your email is from a legitimate server. Here’s what we found when we looked at the median delivered rate, open rate, and block rate of senders with and without rDNS:
Median delivered, open, and block rate of senders with and without rDNS
|
|
Median delivered rate |
Median open rate |
Median block rate |
|---|---|---|---|
|
rDNS |
96.12% |
40.28% |
0.85% |
|
Non-rDNS |
98.79% |
19.92% |
0.64% |
In this section, we focused on senders with a minimum monthly email volume of 1,000, specifically those who actively transmitted messages during the final 60 days of November and December 2022. While senders with rDNS enabled had slightly lower delivered rates and higher block rates, they saw a significantly higher median open rate than non-rDNS-enabled senders.
It's important to note that while rDNS is a valuable authentication method, it's just one aspect of email deliverability. Other factors, such as SPF, DKIM, DMARC, and the content of your emails, also play crucial roles. Additionally, maintaining a good sender reputation by sending relevant and wanted content, along with promptly addressing any abuse complaints, is essential for long-term email deliverability success.
When optimizing your email program, choosing the right ESP can make all the difference. Leveraging an advanced ESP like Twilio SendGrid not only equips you with a comprehensive suite of tools for monitoring your email performance but also facilitates optimal results through our robust partnership with ISPs. That means more messages delivered and better results for your business.
Ready to get started with SendGrid? Get started for free to invest in your email program’s success today.
SendGrid helps you focus on your business without the cost and complexity of owning and maintaining an email infrastructure. And with a full-featured marketing email service that offers a flexible workflow, powerful list segmentation, and actionable analytics, all of your email needs are met in one simple platform.