
Send With Confidence
Partner with the email service trusted by developers and marketers for time-savings, scalability, and delivery expertise.
Time to read: 8 minutes
By now we’ve all worked through our holiday leftovers and emerged from our food comas. For some of us, Thanksgiving is a time to relax, enjoy the company of friends and family, and take advantage of discounts and promotions that find their way into their inboxes. For those sending discounts and promotions, Black Friday and Cyber Monday are best described as “white knuckling” affairs that can make or break a retailer’s entire year. Similarly, we take Black Friday and Cyber Monday just as seriously as our customers—we plan for it the entire year to ensure that our scale matches our customers’ needs and demands.
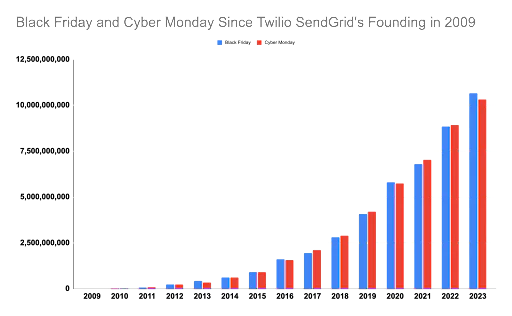
We account for not only the marketing use cases that swell during the holidays but also the follow-up messages that enable e-commerce, the purchase confirmations and shipping notifications, password resets, and every other mission critical email. We built a platform that seamlessly rises to the challenge. Happily, this year, like previous years, went off without a hitch as our customers smashed through the 10 billion email ceiling on both days. As a matter of fact, we’re thrilled to report that Twilio SendGrid processed 10.6 Billion emails on Black Friday and 10.3 Billion emails on Cyber Monday.
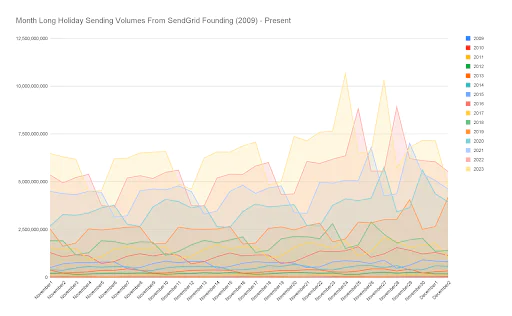
As exciting as the Black Friday and Cyber Monday numbers are, the real story is in the details of the overall performance of our platform and how our customers executed their holiday strategies. We processed over 64 Billion emails during Cyber Week, which was from Monday, November 20th to Monday, November 27th this year. We continue to see double digit growth in email processing year over year, affirming the importance of email as a primary channel for the entire commerce lifecycle.
Our email volumes grew 20.69% and 15.72% for Black Friday and Cyber Monday respectively. One of the questions we’re repeatedly asked is what is the driver of this much growth? Are more businesses adopting SendGrid to power their email, or are our existing customers sending more email? The answer, simply put, is both! Email continues to deliver significant ROI for every dollar of investment and is the most preferred channel for how recipients want to hear from businesses.
Our busiest hour for email sending started at 6 a.m. PT on Friday, November 24th, during which we processed 805.5 million emails. This is a 21.3% increase from 2022. We then saw the most emails opened between 7 a.m. and 8 a.m. PT on Monday, November 27th. During this time, 73.3 million emails were opened, which is a 32.8% increase from 2022. This small but significant discrepancy between peak traffic and peak opens (aka engagement) suggests that Cyber Monday is indeed aptly named. Since it’s a work day for most of us, it makes sense that we’re more tied to our devices while getting back into the swing of our normal week.
The median end-to-end time for email delivery throughout Cyber Week was three seconds. The end-to-end time for all of our traffic didn’t change even during the busiest hours of Black Friday and Cyber Monday. It is worth noting, though, that some individual mailbox providers did have some hiccups during peak hours. On Black Friday, end-to-end times for messages going to the Apple, Comcast, and Orange.fr domains more than tripled. Also notable is a massive increase in Comcast end-to-end times on Cyber Monday that was the result of a technical problem on Comcast’s side.
Mailbox providers block email for a number of reasons. Sometimes it's a technical failure, sometimes it's because the recipient mailbox is full, and sometimes it is because of the sender’s reputation or the content of the email. What’s important to know is that when a mailbox provider does respond with a block, or any other reason code, this is an important signal to capture and process in order to improve each iterative cycle and campaign. This is part and parcel of building a positive sending reputation.
SendGrid is built to help our customers determine why a message was blocked using bounce classifications. Even though there are standards for how bounces are sent, that standard is a basic framework and every mailbox provider does it differently. We capture and aggregate bounces into actionable categories so our customers can adjust their sending practices based on these signals, and likewise so our platform can adapt in an automated way when necessary.
We analyzed how mailbox providers were responding to the increased mail volumes and discovered that overall block rates had fallen by 10%. During Cyber Week, blocks related to message content were down 14.7% compared to a typical week. However, blocks related to sender reputation increased by 36%! It should come as no surprise that we observed a 26.4% increase in spam complaints during Cyber Week relative to a normal week. During the same period, we noticed a 20% increase in what we call “technical” rejections. These are messages that failed to deliver due to a technical problem on the mailbox provider’s end, suggesting that increased email volumes can spell mayhem for even the most scaled systems during this time of year.
Now that we’ve covered the nuts and bolts of what we sent, and how it was received, let’s talk about how recipients engaged with email. 99% of messages sent during the holiday had 20 words or fewer while 90% of messages had between one and 11 words. The most popular subject line length was six words!
Here are some examples of six-word subject lines:
⚡️ CYBER MONDAY STARTS NOW ⚡️
🎁 Cyber Monday bonus deal inside!
Shop local this Small Business Saturday
🖤 Black Friday has arrived!
Our biggest sale of the year
Although six words can be incredibly pithy and impactful, the best open rates went to the true minimalists. Subject lines with two, three, and four words were tied for engagement and were more effective than six-word subject lines. There is no magic number when it comes to a perfect subject line. In fact, the most important aspect of a subject line is knowing your audience, knowing how they think about your brand, and crafting emails that create a bridge between the two.
Speaking of 😀🎃🎄🎆🎇🧨✨🎈–we mean emojis–our team analyzed how senders used these modern hieroglyphs in their subject lines. Since we’re looking at a tremendous amount of data, we focused on the emojis that we saw at least one million times. The top 10 most commonly used emojis were:
Fire - 🔥- 1,013,311,036
Wrapped gift - 🎁- 975,682,513
Sparkles - ✨- 862,490,787
Alarm clock - ⏰- 797,254,705
Party popper - 🎉- 772,935,690
Smiley starry eyes - 🤩- 465,295,866
Explosion - 💥- 457,705,610
Eyes/looking - 👀- 427,480,857
High voltage - ⚡- 388,343,694
Smiling face with heart eyes - 😍- 381,831,928
We decided to take it a step further this year and see if there was a difference in terms of open rates, e.g. which emojis could be associated with successful subject lines. Interestingly, none of the top 10 most commonly used emojis were associated with the subject lines that had the highest open rates.
| Emoji | Name | Delivered | Unique Opens/No MPP | Unique Opens Rate |
📅 | Calendar | 71,046,300 | 13,510,031 | 19.02% |
🚚 | Delivery truck | 32,059,967 | 5,176,994 | 16.15% |
🫠 | Melting face | 1,116,643 | 156,839 | 14.05% |
📝 | Pencil paper | 9,557,166 | 1,341,886 | 14.04% |
🇨🇦 | Flag: Canada | 1,192,080 | 158,553 | 13.30% |
Open rates are driven by personalization and relevancy—if you’re looking for a silver bullet, an emoji isn’t it. However, it is interesting to see how highly engaging subject lines used emojis. We decided to look at the correlation between emojis and click rates. Once again, the top 10 commonly used emojis didn’t make the list of the email subject lines that received the highest click rates.
Emoji | Name | Delivered | Unique Clicks | Unique Click Rate |
🚚 | Delivery truck | 32,059,967 | 1,403,228 | 4.38% |
💋 | Kiss | 70,605,080 | 2,410,753 | 3.41% |
💬 | Speech bubble | 9,189,520 | 306,997 | 3.34% |
🏠 | Home | 30,388,248 | 808,964 | 2.66% |
🫣 | Face w/ peeking eye | 8,994,518 | 183,711 | 2.04% |
Now as interesting as this data is, it’s important to focus on statistics that tell a real and expansive story. Our team spot-checked open rates during Cyber Week and compared them to open rates during a random week in October this year. They discovered that the average open rate during Cyber Week declined by 3.2%. What this decrease suggests is that inbox fatigue is real and recipients are reacting to that fatigue by opening less mail and potentially deleting more mail without opening. Recipients may be relying on subject lines to make the determination of trash versus treasure.
Yes, subject lines matter, but also important is understanding what the optimal threshold for relevant communication is and the cadence that will drive positive outcomes. This has no formula other than to test, baseline, observe, adjust, and retest.
The SendGrid Engagement Quality score measures the quality of our customers’ emails across five key metrics that describe the quality of their deliverability. Throughout the year, the SEQ score for all of our aggregate traffic is remarkably consistent. It rarely moves up or down by more than a tenth of a percent. However, during Cyber Week, we measured a 2.5% drop in our customers’ average SEQ scores. This drop in SEQ scores is because of lower open rates during Cyber Week. Lower open rates can reduce your SEQ score in two ways: 1) it lowers your open rate score, and 2) it also lowers your engagement recency score.
Increased volume and frequency can turn off recipients, which in turn changes how they engage with emails. Although recipients have been conditioned to expect the inbox bonanza that is Cyber Week, they also have the ability to mark emails as spam, delete emails, unsubscribe, and simply not engage with content and senders that are overzealous or appear far too frequently. Don’t assume that the holidays give you carte blanche to email your customers endlessly–there is a point of diminishing returns, and that diminishment is measurable!
As the dust settles from this year’s Cyber Week, it’s important to recognize that email as we know it is changing. Not only has Gmail announced new sending requirements that Yahoo! and other mailbox providers are adopting, but we also continue to see the denigration of the open tracking pixel through Apple’s Mail Privacy Protection (MPP). MPP opens accounted for nearly 70% of all opens during Cyber Week! The open rate, once the gold standard of tracking email engagement, is no longer a key indicator of success.
There are two things to take into consideration as you plan your next holiday sending event:
Focus on clicks as the ultimate arbiter of engagement. Clicks are not only a reliable metric but also a key action you want customers to take as part of driving a conversion.
If you aren’t already using it, we strongly recommend you use the Twilio SendGrid Flag to help you identify non-human email engagement driven by MPP and other caching systems.
In order for us to make better decisions we need good data, and that starts with understanding who is opening emails–a machine or a human being. All in all, we saw a very successful holiday season that was defined by strong growth, exceptional deliverability, and once again, meeting customer expectations at a crucial time of the year.
To learn more, watch our latest webinar, Driving Meaningful Customer Engagement at Scale During Cyber Week.
Partner with the email service trusted by developers and marketers for time-savings, scalability, and delivery expertise.