The Complete Email Metrics Guide (with Formulas)
The top 12 email metrics and KPIs you should be measuring.
The top 12 email metrics and KPIs you should be measuring.

Firing off email after email without measuring and learning from your success won’t help your email program improve. Email can help you learn a lot about your customers, but only if you collect the right data and listen to what their behavior tells you. In order to gain a detailed understanding of your email performance and what happens to your emails after you press “Send,” you need to have an understanding of email metrics.
From bounce rate to unsubscribe rate, the measuring and tracking of key email metrics gives you a full picture of how your email program performs and where your areas of improvement lie. In this guide, we break down the most popular email metrics, what the metrics mean, and how to measure them. With the right email metrics and performance insights, you can send better, more effective emails that your recipients will love.
Every email program is unique, so the metrics you and your business care about might be different from others. In order to determine what metrics you want to measure and track, it helps if you know what your options are. Here’s an exhaustive list of email metrics to help you pick and choose which ones will help you evaluate your email program’s success.
Another event to keep an eye on is blocks. An email is blocked when the receiving server denies the message for a reason that is not tied to the quality of the recipient’s address. For example, your message could be blocked if:

Making sense of countless cryptic delivery failure responses from mailbox providers and ISPs can be confusing. Luckily, Twilio SendGrid’s bounce and block classifications can help you make sense of the different Simple Mail Transfer Protocol or SMTP and remedy any issues holding you back from landing in your recipient’s inbox.
Bounce rate measures the percentage of sent emails not successfully delivered and returned to the server that sent them. To calculate email bounce rate, divide the total number of bounced emails by the total number of emails sent and multiply that amount by 100.

It is important to note that not all bounces are the same. In fact, there are different types of bounces: hard bounces and soft bounces. Here is how the two differ:
Having a large number of hard bounces might mean it is time to introduce a double opt-in so users have to proactively confirm they subscribed to your list, as well as invest in a new email sunset policy to help improve your sender reputation and engagement metrics. Having a poor or non-existent sender reputation can also contribute to soft bounces known as deferrals, so you’ll want to periodically check your sending reputation to ensure yours isn’t holding you back from landing in customer inboxes.
Click-through rate (CTR) measures what percentage of your recipients clicked on at least one link in your email. To calculate CTR, take the number of unique clicks your email received and divide it by the total number of emails successfully delivered. Take that amount and multiply it by 100, and you have your CTR for a given email or email campaign.

While the above formula actually gives you a unique click-through rate (UCTR), you can also track the total click-through rate (TCTR). TCTR uses the same formula but swaps out unique clicks for total clicks in the fraction’s numerator. For example, if recipient A opened your message and clicked on 3 links, your TCTR would account for all 3 clicks, while the UCTR would only attribute 1 click to this recipient. A high TCTR indicates that many of your recipients opened and clicked your messages multiple times.
Wondering which one to measure? Both have benefits, and it is really up to you. Many companies favor UCTR as it is a “cleaner” picture of engagement, but you can always calculate and compare both metrics to ensure you have a healthy number of subscribers clicking on your content multiple times.
While sometimes confused with CTR, click-to-open rate (CTOR) measures what percentage of recipients who opened your email also clicked on it. The main difference lies in its equation’s denominator: To calculate CTOR, divide the number of unique clicks by the number of unique opens and multiply the answer by 100. As a reminder, CTR has the total number of successfully delivered emails in the denominator so that’s what sets these two metrics apart!

For example, say you sent a marketing email to 1,000 recipients and that email generated 500 opens and 20 clicks. Your 20 clicks divided by 500 unique opens multiplied by 100 would give you a CTOR of 4%, while your UCTR would only be 2%.
Now, say you hosted a giveaway and doubled your email list to 2,000 recipients. If you now send 2,000 emails but your engagement stays the same (500 opens and 20 clicks), your new CTOR would still be 4%, while your UCTR would decrease to 1%.
CTOR is an important email metric to track, as it can give you more insight into your click-through-rate data and how your content performs. If you rely heavily on UCTR without the added context of CTOR, you would think your email performance tanked in our second example. In reality, it wouldn’t be cause for concern just yet if your longtime loyal subscribers were engaging with your content as always. Even still, you’ll want to be mindful of how your UCTR could impact your CTOR, especially as your list grows.
The campaign ROI metric is an email marketer’s best friend, as it helps you evaluate the profitability of your email campaigns and show the impact of your investments. It is also a particularly important metric to have on hand when negotiating additional budget and earning leadership buy-in for your program.
To calculate campaign ROI, you will first need to determine the campaign’s net profit. You can determine this by taking the campaign’s total revenue and subtracting however much you spent to execute the campaign (or your total campaign costs). Then, take that outcome and divide it again by your total campaign costs and multiply the answer by 100. Put simply, the formula is:

If you’re looking for more granular insight into how much revenue each individual email you sent generated—rather than overall campaign results— you can measure revenue per email (RPE). This metric should always be looked at in tandem with campaign ROI as it only measures revenue, not profitability. After all, high revenue won’t mean much if you’re spending more than you’re bringing in.

Conversion rate tells you what percentage of recipients take the intended action from your email. This could be webinar registrations, password resets, demo views, content downloads, purchases—you name it. To calculate this engagement metric, you need 2 values:
Divide your total number of recipients by the total number of emails you sent and multiply the outcome by 100 to calculate your conversion rate. For example, say you sent 1,000 emails marketing the launch of a new sneaker, and 50 recipients bought the sneaker after receiving the email. You would divide the 50 recipients by your 1,000 delivered emails and multiply your answer by 100 to get a conversion rate of 5%.

Delivery rate is calculated by comparing the percentage of mail accepted for delivery against the amount of mail sent. To clarify, any email rejected by an ISP would not count as delivered, while any message that landed in a recipient’s spam or junk folder would. To calculate this metric, divide the total number of processed messages by the number of messages delivered and then multiply the result by 100.

A word of caution: Even if your delivery rate looks healthy (meaning, you see very few bounces and most of your emails are delivered), it is still possible that your emails will never make it to the inbox. Internet service providers (ISPs) might have received your message but then decided to place your email into the spam folder. Even with a stellar delivery rate, you can still have deliverability issues.
Forward rate, or share rate, is the percentage of recipients who forwarded your email to another person using a “Share” button in your email. This metric can indicate your recipients liked your content enough that they wanted to share it with a friend, family member, or colleague. While forward rate is more of an ancillary metric, it can still help you keep a pulse on how relevant your customers find your messages and whether they share your brand with their networks.
To calculate forward rate, just divide the number of forwards your email received by the total number of emails you sent and multiply the result by 100.

Inbox placement rate (IPR) measures what percentage of your emails actually land in recipients’ inboxes—whether that be a primary, promotional, update, or social tab in Gmail, or a focused or other tab in Outlook. It differs from delivery rate in that it only measures messages that landed in the inbox and ignores any messages delivered to junk or spam folders.
Usually, there are 2 approaches to determining IPR:
1. Marketers/ESPs/ISPs: Inbox placement is the percentage of mail that ends up in the inbox rather than the spam folder, and you can calculate it using this formula:

2. Third-party tools: Historically, third-party tools break IPR down into 3 pieces: Inbox placement, spam placement, and missing mail. “Missing mail” refers to when a portion of the seed list did not receive the message in their inbox or spam folder due to a block or failure to send.
While IPR is a key way to measure your deliverability and understand what percentage of your messages actually reach your recipients, it is not infallible. In order to get a full picture of your program’s deliverability, as well as gain insights into how to improve your business’ ability to land in recipients’ inboxes, you should look at IPR alongside other key metrics using your first-party data.
To improve your business’ deliverability rates, focus on sending engaging content your subscribers want to receive, authenticating your email domain, maintaining proper IP allocation, and improving your sender reputation.
CHECK OUT OUR 2021 EMAIL DELIVERABILITY GUIDE FOR EXPERT TIPS ON HOW TO LAND IN RECIPIENTS’ INBOXES.

Similar to click-through rate, open rate (OR) can be measured by total or unique opens. Unique open rate (UOR) is generally more common and measures what percentage of your recipients open your email. To calculate this popular metric, you need 3 variables:
Then, use this formula to determine your open rate:

OR can be a good way to tell if your recipients find your emails engaging and to evaluate the effectiveness of your subject lines and preview text. That said, treat the OR as an estimate because it can easily be off if an ISP blocks images or if a recipient has opted in to Apple’s Mail Protection Privacy. Just remember, it is normal for your email open rate to vary by campaign. For example, your audience might flock to item restock emails while your re-engagement campaigns see less promising metrics. Tracking your data by campaign, rather than by individual email send, can help give you more context against which to assess your email performance.
If you wanted to measure total opens instead, just swap the number of total opens for unique opens in the formula’s numerator and calculate your total open rate, or TOR.
Keeping an eye on your open rates can help you identify and fix deliverability issues as the issues arise. For example, if your open rate decreases when your sending behavior has remained the same, this could mean there is an uptick in your emails landing in your recipients’ spam folders. By catching this change in open rate early on, you can proactively address any issues and ensure your messages reliably reach your subscribers.
While your subscriber list will always be in flux as subscribers come and go, you should ensure the list’s size increases at a healthy rate so that you can continue to reach new audiences and help your business grow. The list growth rate metric helps quantify your list health by allowing you to track list churn and growth over time and measure the impact of your efforts.
To calculate list growth rate, you will need the total number of:
Next, use the following formula to determine your list growth rate for a given period:

CHECK OUT OUR GUIDE FOR 7 STRATEGIES FOR GROWING YOUR EMAIL MARKETING LIST.

Spam complaint rate tracks the number of people who have reported a specific email as spam. To calculate the spam complaint rate, divide the number of messages marked as spam by the total number of messages sent and multiply the result by 100.

For example, if you send 10,000 emails and 10 recipients mark the message as spam, your spam complaint rate would be 0.1%, or 10 divided by 10,000 multiplied by 100. A high spam complaint rate could indicate your recipients do not remember signing up to receive your content, do not find your content valuable, or no longer want to hear from your brand. You should keep tabs on your spam complaint rate as a high rate can negatively impact your sender reputation and deliverability.
CHECK OUT OUR 10 TIPS TO STOP YOUR EMAILS FROM GOING TO SPAM ARTICLE.

Unsubscribe rate measures what percentage of your recipients unsubscribed from your list from a specific email. To calculate unsubscribe rate, divide the number of unsubscribed users by the number of messages sent and multiply the result by 100.

While your subscriber count will always be in flux, it is important to keep tabs on your unsubscribe rate to understand if particular content turns off your recipients or if your list growth strategy brings you predominantly uninterested and unengaged users. At Twilio SendGrid, we recommend senders aim for an unsubscribe rate of less than 1%.
A preference center gives your recipients the ability to specify what type of content they want to receive and how frequently they want to hear from your brand. It is a great way to improve your email program’s deliverability and your brand’s relationship with subscribers.
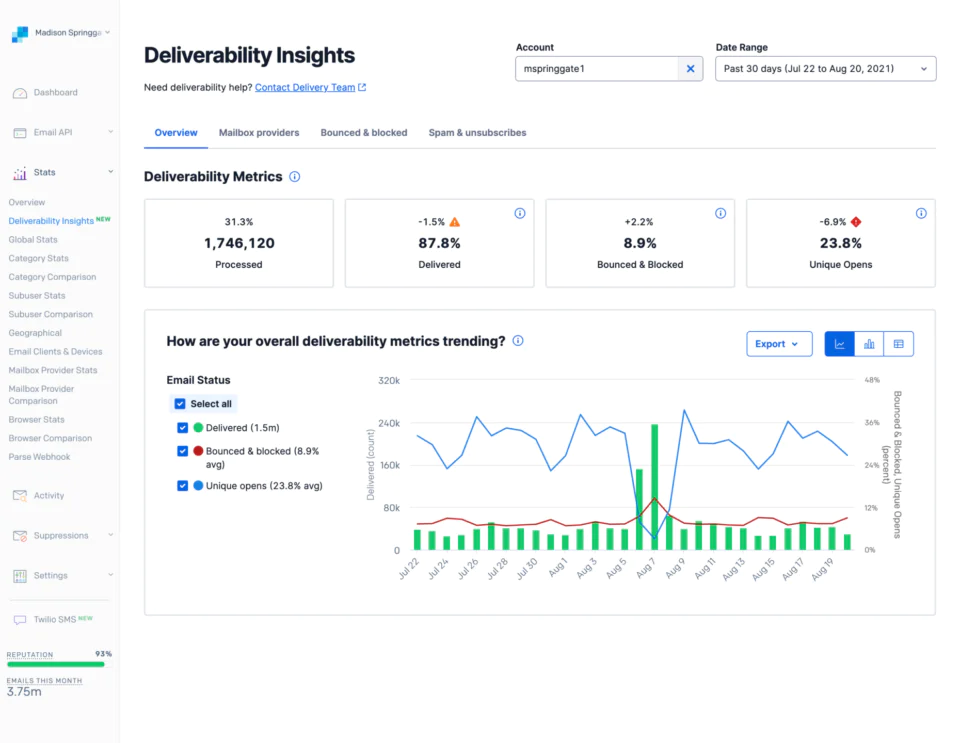
Overwhelmed by the sheer number of email metrics you can measure? Don’t be. Partnering with the right email service provider can make it easy to measure your email performance and track changes over time. Say goodbye to spending hours manually crunching numbers in spreadsheets, Twilio SendGrid’s new Deliverability Insights dashboard allows you to monitor and improve your email program health from a single location.
Our dashboard enables you to easily see the data you care about most—like delivery rate, bounce rate, open rate, and more—in an actionable and easy-to-digest format. You can even filter metrics by mailbox provider to get a more detailed look at your performance and determine where to make improvements. And, of course, you can track data trends over time to understand if your team’s efforts drive the needle on your email program’s success.
Email is a data-rich channel, but what good is it to track data if you do not use it? Not only does our Deliverability Insights dashboard make it easier to view your email metrics, but it also gives you expert recommendations based on your performance that you can use to better serve your audience. This personalized, professional-level support is available directly in your dashboard so that you can easily review it and take action quickly to improve your email deliverability.

Save yourself the hassle of manually tracking your email metrics and gain more insight into how your email program fairs over time with Deliverability Insights. Click here to learn more about Deliverability Insights and how to take your emails to the next level.

Now that you know all the most popular email metrics, you can decide which ones your business should measure and track. Pick which metrics give you the most insight into your deliverability performance so that you can use this information to optimize your campaigns, reach a larger audience, and exceed your email goals. Just remember, each of your campaigns will have different goals, so you might need to use different metrics to evaluate success. For example, a lead generation campaign might be more concerned about conversions, while a re-engagement campaign might care more about click-through rates. Always consider your campaign goals first, then find the metrics that make the most sense for your business to measure.
If you’re looking for a quick and easy way to track your overall email program’s performance, our Deliverability Insights overview chart is a great starting point. It can help you spot an increased bounce rate or a falling open rate as well as give you the powerful insights you need to dig deeper and act quickly.
To unlock the full picture of your email program’s performance, speak to one of our email experts on how to get started with Deliverability Insights or create a free account and start sending with Twilio SendGrid today.
SendGrid helps you focus on your business without the cost and complexity of owning and maintaining an email infrastructure. And with a full-featured marketing email service that offers a flexible workflow, powerful list segmentation, and actionable analytics, all of your email needs are met in one simple platform.