2019 Email Benchmark and Engagement Study
Email statistics from senders and recipients
Email statistics from senders and recipients
For the last 3 years, Twilio SendGrid has developed and published our Global Email Benchmark Report. In 2019, we’ve decided to take a different approach for this report. In addition to global email engagement benchmarks that we see from the sending side of things, we’ve also performed a study on the people receiving all those emails.
The 2019 Email Benchmark and Engagement Study is more impactful and useful than ever before. We continued our work with internal data scientists to provide engagement data that we see from senders, sending over 60 billion emails each month. Global benchmarks that we report on include:
In addition to that, we performed an entirely new study focused on how recipients engage with email. Through this work, we’ve been able to answer a number of questions that are valuable to email senders, including:
Like our reports in the past, this report can help senders make improvements to their current email program by learning about how email is being engaged with, where, and on what devices. By reading this report, you’ll be able to know a few different things:
We coach our customers to listen to their recipients more than anything. Knowing that your industry’s average open rate is 5% doesn't mean much if the average open rate for your contact list is 15%. As a result, we’ve changed the focus of this report from previous reports, and are instead providing data on how recipients engage with the email they receive.
This benchmark report contains metrics from email sent through Twilio SendGrid. These same metrics and methods have been applied in previous years and will be applied to future years and subsequent reports to consistently compare changes in email statistics and devices in different email regions.
The data for this analysis came from approximately 100 million recipient engagements from over 100,000 different senders. All data is anonymized and only analyzed/reported in the aggregate.
This report is primarily representative of business to customer (B2C) email for the countries in which we have significant market penetration.
This study may not be representative of personal email.
Twilio SendGrid collects metadata on all events in the email process, including delivery to the inbox provider, opening of email, and any clicks on links within emails. We use metadata to provide services and information to our customers and to improve our service as a whole.
For the benefit of our customers and all email senders, we’ve summarized this data in the aggregate segmented by:
Here’s how we analyzed and segmented our data:
Associating email with geography – IP addresses collected from opens and clicks were geolocated using up-to-date databases.
Detecting recipient devices – SendGrid uses user agent parsing libraries to automatically infer and categorize the hardware and software being used by a recipient when they open or click an email.
Determining recipient inbox provider – Recipient inboxes are inferred from the domain in the email address and from the IP address associated with the domain.
The global email benchmarks for 2019 are quite a bit different from what we saw in 2018, and they reverse a couple trends that were developing:

This data reiterates a lot of what we’ve coached senders on for years: as the number of messages to recipient inboxes increases, the engagement with those messages drops.
As we can see, the average number of messages sent to recipients increased to 8.3 in 2019. This corresponds with the drops in Aggregate Open Rate, Aggregate Click Rate, and Click-to-Open Rate.
An interesting note is that the Click-to-Open Rate continued to drop for the fourth year in a row. We believe that this demonstrates that recipients are increasingly selective about what messages they’ll interact with. While many recipients will open their emails, they’re not going to click on just any link within an email.
The drop in Click-to-Open rate could also signal that messages are too generalized. This is where larger, more sophisticated senders have the upper hand. Senders who are able to add more personalization have a better chance at getting those messages opened.

People will check email on almost any device they own. Whether they’re at work on a laptop, at home on their phone, or traveling with a tablet, people check their messages many times a day. It’s more important than ever before that your messages are able to load properly across all inbox providers, browsers, and devices.

This table shows the percentage of recipients that have that type of inbox provider in each country, not the volume of email each inbox provider receives in each country. Each recipient gets counted once per email address. If a person has one account, regardless of how many messages go to that account, they’re only counted once.

Twilio SendGrid uses user agent parsing libraries to automatically infer and categorize the hardware and software being used by a recipient when they open or click an email. In the table above, a “generic” device is typically something that is running on the Android operating system, but has masked the type of device used. These mobile devices could be a combination of any number of device manufacturers like Huawei, LG, Google, OnePlus, Motorola, etc.
Consider looking at your click rate at the device level. If you see that there's a strong click rate on Android devices, but there's a drop-off when it comes to iPads, it could point to emails not working correctly on those devices and/or operating system. We've met with some customers who haven't re-worked their emails in years, and as a result, they don't work with the updated software.
While it’s helpful to know what the email engagement benchmarks are as a sender, there’s an equally important aspect of the email communication channel: the recipient. This year, we set out to answer some fundamental questions around recipient engagement:
By listening to recipients and learning about what they’d like to see in their inboxes, senders can craft and send more valuable emails that have a better chance of being opened and engaged with.
")
The recipient engagement portion of this report was conducted with a qualitative ethnographic study, and a quantitative online survey, both of which were conducted in the United States (U.S.) and the United Kingdom (U.K.).
To gain qualitative email insights and to track daily email usage habits, we interviewed 40 total study participants, with 20 in the U.S. and 20 in the U.K. The sample was segmented by age group, divided into the following age brackets:

The participants used a mobile ethnography app to answer email-related questions throughout the day. They were sent 3-5 questions a day for 5 days. Using video responses (approximately 1-2 mins in length), along with screenshots and phone-screen recordings, participants shared with us their daily email habits. This gave us more detailed feedback than an interview alone, as it allowed us to observe and track over time.
At the conclusion of the week, we debriefed with participants in an in-depth video interview lasting 30-45 minutes.
Once we completed the mobile ethnographic study, we wanted to quantify those qualitative themes, and see if these findings applied across a statistically valid sample size. We developed an online study that was conducted in the U.S. and the U.K. with 800 participants from each. Those participants were then divided up amongst the 4 different age categories so that 200 participants in each category completed the survey.
Throughout all our research, one thing was reiterated over and over again: email is not only important, it’s an essential channel for communication between recipients and companies. Most of our study participants say the emails they receive from businesses are valued because they provide important information that they want.
Emails help people track what they’ve bought online, when orders will ship, alert them to sales and discounts, remind them what bills they have to pay, and provide updates about the brands they love. Email has become a part of their morning rituals and routines. Some even say they’re addicted to their email.

Across the U.S. and the U.K., and across all age groups, 84% of participants check their email at least once a day, with the majority of people checking messages numerous times throughout the day.
Email is ingrained in everyday life for almost everyone. We found that across all study participants, email was the most essential communication channel. 97% of study participants consider email to be essential, followed by text messages, and then social media.
“I periodically check it through the day when I’m working, or just whenever I have time during my day.”

Email isn’t going anywhere. Participants in the study not only use email on a daily basis, they want to receive communications from companies via email messages. Email is the expected channel for promotional content from businesses they interact with.
“I check my emails in the morning and while commuting to work on public transportation. I check emails throughout the day to see if there's anything that requires an immediate response. In the evening, I will go through emails using my laptop as it's quicker to type with a keyboard.”
With so many messages going to recipient inboxes, and with recipients checking their email multiple times a day, as a marketer, you should be thinking about how you can make your email as targeted and personalized as possible.
We saw in Twilio SendGrid’s email benchmarks that the average number of emails sent each month to recipients increased from 7 in 2018 to 8.3 in 2019. We wanted to learn more about how comfortable recipients are with the amount of email they receive and the frequency of messages they get from companies they’re interested in.

Based on these results and our qualitative study, recipients are more forgiving when emails are sent by one of their favorite retailers. They’re even open to the idea of receiving daily messages, just as long as they want the product or service offered, or they’re particularly interested in the sender or brand.
For the most part though, receiving too many messages in a short span of time often results in a quick deletion, and can trigger an unsubscribe with repeat offenders.
Most of our study participants said they would only like to receive promotional emails from retailers once a week, and just a few say they are fine with daily emails. A few others are open to seeing emails outside of this frequency if a limited time offer is involved.
Email senders should identify which recipients want to receive email once a day, and which want to receive email once a week. Once you have an idea of who wants to receive a lot of email and who doesn't, you should think about your offers. Do your offers necessitate a once per day email? Are you sending different offers each day, or are you sending the same thing over and over again?
FIND INSPIRATION FOR YOUR 2020 EMAIL CAMPAIGNS WITH OUR 2020 EMAIL PLANNING CALENDAR. THE CALENDAR IS PACKED WITH OUT-OF-THE-BOX EMAIL CAMPAIGN IDEAS, EXAMPLES OF OUR FAVORITE EMAILS, AND STRATEGIES TO LEVEL UP YOUR MARKETING PROGRAM.

If you were asked right now, what were the last 10 emails you opened, would you be able to name them? Chances are, you might be able to describe a couple, but not much more than that. There’s more email being sent today than at any other time in history, which is why making an email memorable and interesting to recipients is so important.
We wanted to learn more about what makes a good, successful email stand out from the rest. So we asked our study participants to provide us with their insights and opinions around a number of different email elements, including:
Below, we’ll dive into each of these topics with the relevant quantitative analysis and any relatable insights from our mobile ethnography.
These days, some level of personalization is expected in essentially every email that comes to the inbox. Whether you’re including a recipient’s name, including specific information exclusively for them, or just sending them product offers, recipients expect senders to know something about them.

Across both the U.S. and the U.K., 26% of study participants said that personalization is something that would make an email very memorable. Another 38% of participants said that personalization would make the email somewhat memorable.
“Companies can sort of hone in on your likes or products that you tend to get so they can tailor what they're sending you.”

When we compare the U.S. and the U.K. next to each other, we see that responses were very similar. 29% of those in the U.S. said that personalization was something that made an email very memorable, compared to 22% in the U.K.
In interviews and in our mobile ethnography, many recipients suggested they would be more inclined to read emails they receive (and not delete or unsubscribe from them) if they were more personalized or relevant. Recipients like seeing emails that include their name because it suggests the content is exclusively for them.
“I like it when they use my name and put something in there that is more than just some sort of automated thing.”
Personalization no longer means adding a first name or a location to an email, those things are expected. Real personalization means providing content and offers specific to the recipient and their past actions or purchases.
Imagery is an essential element of just about every email. Whether you’re including pictures of your products, a background image in your brand’s colors, a GIF highlighting new features, or a video walkthrough of your software, images help you convey your message. We wanted to learn what the right number of images is for an email from the recipient perspective.

Overall, recipients want images in their emails, but they only want a few at most. The vast majority of participants, 85% across the U.S. and the U.K., indicated they’d like 1 to 3 images in their emails at most.

Looking at the four age groups across both the U.S. and the U.K., we see that for the most part, people want to see one, two, or three images in an email. Very few participants wanted no images, and even fewer participants wanted five or more images in an email.
“I like a lot of pictures in my emails. If I just get a bunch of words and everything in the email was just typed, I don't want to have to read through that. I prefer emails that have lots of pictures but get the point across and give me the information I need.”
Through our interviews and mobile ethnography, our participants told us a few additional things about what they think about images in email:
To learn more about their opinion of GIFs and video in email, we asked them if they liked GIFs and video in email from companies advertising products or services.

Across all age groups and locations, the majority of people do not like GIFs or videos in their emails. The most tolerant age group across the two countries were Millennials, with 51% saying they did not like GIFs and video. The most intolerant of the age groups were Baby Boomers, with 76% saying they didn’t like GIFs and video.
When we looked at the data more granularly, to see the age groups within countries, there were some other interesting takeaways.
Think about the bandwidth your recipients may or may not have. Every image you include in an email means that it'll take longer to load and increase the chances of an image breaking, which leads to a poor recipient experience.

When age groups are split by country, we see that there are some where the majority of participants actually like GIFs and video. Millennials and Gen Z participants in the U.S. both indicated they like these moving images with 56% responding with “yes.”
Another interesting note is that U.S. participants were much more tolerant of GIFs and videos than those in the U.K.. The group that indicated they absolutely do not like GIFs and videos are Baby Boomers in the U.K.. Some qualitative insights we got about GIFs and video include:
The content within an email is just as important as every other email element. An email with a great subject line and no content doesn’t provide the recipient with any useful information. Email content should be descriptive and provide your recipients with information about the offer you’re sending, or tell them why they should engage with the links in the message. Like images, having too little content or too much are both turn-offs for recipients:


Much like their criticism of subject lines, study participants really dislike emails that are too long and wordy, and not very concise. However, an email with no content, and just images is also not interesting to recipients. The general consensus is that an email should definitely have some content, just not too much. Other qualitative takeaways include:
“If it becomes too long, then you're not going to read it, unless it's obviously some sort of whitepaper or something that you want to read. But if it's something that's just out there just to grab your attention, it should be just scrollable very quickly.”
Email recipients expect an email to load properly on the device they’re using to view it. Whether it’s a phone, tablet, or computer, your email should appear correctly so that they don’t have to zoom in or scroll awkwardly in order to read it.

Of all participants, 66% said that it is essential for an email to load properly on all devices. In the U.S., this percentage grows to 70% of participants, and drops to 63% among U.K. participants.
Study participants specifically told us that they would like it if senders formatted their emails so that they display properly on different devices, and take into account the narrowness of phones versus the wider displays they have on their computers and laptops.
“I'm checking email on my phone a lot, so if it doesn't fit, and if it's not sized correctly for my phone, I'll probably delete it.”
We also wanted to learn more about how often email recipients open an email on one device, and then switch to another.

A quarter of respondents said they “never” switch between their phone and computer, while about 60% said they seldom or sometimes switch between the two. Recipients may not switch between devices a lot, but when they do, the email should load properly.
We saw in our qualitative study that recipients may not go from one to the other very often, but sometimes it makes sense to switch to a computer. If recipients see an offer or promotion that looks particularly enticing on their phone, some will switch to their computer to take advantage of it and complete their transaction.
GET YOUR EMAIL PROGRAM IN TIP-TOP SHAPE FOR 2020 WITH OUR UPDATED BEST PRACTICE GUIDE.


Based on our study, the group of people who said they switch between devices the most were Gen X participants in both the U.S. and the U.K. 11% said they frequently switch between devices, and 43% of Gen Z recipients in the U.K. said they sometimes switch between the two.
What’s interesting here is that it is the younger age groups that say they’re switching from their phone to the computer and vice versa. 35% of Baby Boomers said they never switch between the two, while only 20% of Gen Z, 22% of Millennials, and 28% of Gen X participants said they never switch. Millennials had the highest percentage of sometimes switching at 38%.
Responsive design doesn't just mean ensuring your email loads and displays properly across devices, it means ensuring your calls-to-action are relevant across platforms. If you're sending an email that has a link that opens an app on a phone, the experience may be broken if the recipient is clicking that link on their desktop. The link on the desktop should go to a landing page that describes the feature in more detail, encouraging the recipients to go back to their phone and engage with the app.
We saw in Twilio SendGrid’s email engagement benchmarks that the aggregate open rate for email dropped this year to 14.5% while the number of emails sent by all senders increased in frequency. For recipients, this means they’re getting a lot of email in their inboxes, and they have to decide what they want to open.
We asked participants in both the mobile ethnography and the online survey to rank the elements of an email that impacted their decision to open the message:

Overall, the most important element of an email that impacts a recipient’s choice of whether they should open it or not, is the sender. Recipients typically check who an email is coming from before choosing to read the subject line or determining what’s inside the email itself.
The sender instantly conveys where an email is coming from. Emails are more likely to be opened when recipients have some relationship with that company, or are expecting to receive emails from these trusted, subscribed-to sources.

The chart above shows that across all ages in the survey, more than half of respondents said that the sender would strongly influence their decision to open an email. That influence is strongest with the Baby Boomer group, with 61% saying that the sender is a strong influence. The Gen X group had the lowest number of people saying the sender is a strong influence, at only 45%.
“Who the email came from is most important to me. If the subject captures my interest, then that is second. If the sales offer or discount appears to be good, I will open it.”
You can think of opening an email like opening the door to your house. If you look out the peephole and see someone you know, you're a lot more likely to open the door, as opposed to just seeing a stranger holding a box.
For some recipients, the sender alone is all the information they need to open an email, especially when they are very fond of a particular brand. In general, when recipients open their inbox, the sender is the first thing they look at, and if they don’t feel like seeing that company’s product or service, they scroll right past.
Another interesting thing is that the sender remains the most influential factor for opening an email across the U.S. and U.K. as well. Below are charts comparing how the sender influenced study participants in the U.S. and the U.K. The results are very similar:

The bottom line is that your emails are much more likely to be opened if the recipient knows who you are and is interested in your company or brand. Messages getting sent to recipients who are unaware of you, or who have never interacted with you in the past, are going to be ignored.
Recently, political senders have been employing the use of “friendly from” addresses in their emails. Friendly from addresses are the visible part of an email address displayed in email clients as the person/entity sending the message. For instance, the email address might include a familiar name like “Britney.Spears” and @yourdomain.com. This tactic may seem like a good way to stand out in the inbox, but in reality, if it confuses recipients, it may be ignored or even flagged as spam.
Recipients want to have a clear idea of what an email is all about before they even open it, which is where subject lines come in. However, recipients didn’t indicate that subject lines have more influence over their decision to open than who the email is coming from:

Unlike with the sender of an email, participants were a little more unsure of how influential an email’s subject line is on their decision. Most study participants were split between a subject line strongly influencing the decision, or just somewhat influencing the decision. This split is reflected across the U.S. and U.K., too:

Subject lines should be clear and concise, and descriptive enough so they are not vague and ambiguous. Participants said they liked subject lines that were interesting and informative, have a hook, or present information in a fun and catchy way because they’re more compelling.
“The subject line is most likely to draw me in and I'll notice that before anything else.”

“Something that summarizes the content is good. If it's ambiguous, I really don't connect. I just feel like it's click bait.”
The content of an email is an extension of the subject line and sender. Typically, the purpose of the subject line is to describe the content of the email itself and encourage the recipient to open the message, but the best subject line ever written won’t help if the content of the message isn’t relevant or interesting. One really doesn’t work without the other.

What’s inside the message is the second most influential factor when it comes to the open decision, and this data reflects what we heard from our mobile ethnography participants:
For senders, this means that the sender, subject line, and content are all working together pretty closely. A recipient wants a clear descriptive subject line that tells them about the value inside the email, from a sender they recognize and like. This influence was reflected across both countries as well, with the U.S. ranking content as having slightly more influence than the U.K.

For many ecommerce businesses, the subject line is really just a way to inform recipients about their current offers and promotions. You’ll notice plenty of these in your inbox right now:
A lot of study participants will scan their inbox for large discounts, verify the sender, and then choose to open the email itself.

Interestingly, the influence of the offer or promotion was ranked differently between the U.S. and the U.K.:

U.S. participants seem to indicate that the offer or promotion is more influential to them than their peers across the pond. In the United Kingdom, participants leaned more toward offers and promotions having “somewhat” of an influence on their choice.
Our qualitative study participants told us that deep discounts, sales, and promotions often catch their eye, particularly when these are touted in the subject line, but what’s sold must align with what they need. Several recipients said they wouldn’t bother opening an email unless they received at least 40% off.
“If it's a quick thing, I might read it and then keep it in my inbox before deleting it. Unless it says act fast now and get 50% off this item, I'll probably just let it sit there.”
Recipients are skeptical of receiving the same coupon week in and week out. When each of your emails provide recipients with 20% off a purchase, they no longer stand out in the inbox.
As we showed previously, the vast majority of email recipients are checking their email multiple times each day. This means that the time of day that they receive an email isn’t as important as it may have been in the past. While you want to make sure your email reaches people, and stays toward the top of the inbox, most recipients are going to check their messages to see if they’ve received anything recently.

Of all the email factors, time of day was ranked as having the least influence on the decision to open an email. On average, only 13% of all participants indicated that time of day had a strong influence on their decision. This was also reflected across both countries:

During our mobile ethnography study, our participants echoed these quantitative results. Participants said that time is of little importance, as they check email throughout the day, and they will open a good email regardless of when it is received. The only time they said that time of day was important was when the message was time sensitive.
“Time of day received is my least important. I don't care what time of day I receive an email unless it's very important...”
As you continue along the recipient’s engagement journey, after they choose to open an email, they’re brought to another decision: what should I click on in this email? Over the last 4 years, the average click-to-open rate has dropped from 13.6% in 2016 to 10.9% in 2019. This suggests that recipients are opening messages quite a bit, but they’ve become more selective on the offers they’ll actually click on within messages.
In order to learn more about the decision to click on links within emails, we asked study participants to rank how influential each of the following factors would be in prompting them to click on a link:

Unlike the decision to open an email, there isn’t one factor that clearly influences the decision to click links more than others. Across all study participants, the email factors with the highest percentages of respondents saying they would strongly influence their decision, include:
These factors also had the lowest percentages of recipients saying they wouldn’t influence their decision very much or at all. The other email factors (link color, link copy, and link placement) don’t seem to have nearly as much influence on the choice to click on an email. When we looked at how the U.S. and the U.K. ranked these factors, some interesting differences arose:


Unlike the U.S., participants in the U.K. ranked factors as having a strong influence much less than the participants in the U.S. For instance, when it comes to critical information in emails, only 29% of U.K. participants said that factor had a strong influence, as opposed to 43% of U.S. participants.

The offer/discount within an email had the highest percentage of people who considered it to have a “strong influence” on their decision to click on a link at 39%.

These rankings reflect what we learned earlier about why participants choose to open an email. If an email is touting a deep discount in the subject line, the recipient may choose to open the message itself, and in order to capitalize on the discount, they’ll have to click on a link to the site.
Other emails may be very informative and get opened, but they don’t necessarily require a click on a link. A newsletter or welcome email is a good example of an email where a recipient might open the message, but not necessarily click on any of the links.
While some promotional emails are very straightforward, others require some content in order to drive value and influence recipients to take the next step by clicking on a link. The content of an email had the second most rankings of “strong influence” at 37%.

This is good news to any email marketer out there spending time crafting good, informative email content because it shows people are actually reading and evaluating what you’re sending them. As a sender, you should try to send your recipients messages that provide value. Not every email campaign can be a 50% off promotion.
Critical information in an email can be many different things, but generally, it’s information that’s included in transactional emails:
We looked at these types of emails and what they provide as different from the more general “content” email factor.

Study participants were split on how much of an influence critical information has on their decision to click links with 36% saying it would have a strong influence, and 34% saying it would have somewhat of an influence. Millennials had the highest percentage of participants saying it would have a strong influence at 41%.
For something like a password reset email, the whole purpose of the message is to provide you with the link inside the email. For others, like a purchase confirmation, a recipient will most likely open and look at the message, but they probably won’t click on anything inside, unless something looks wrong.
Recipients view emails from brands they like, with information about products they want, to be more than just promotional emails. Study participants told us emails that are informative and functional get attention and are useful. They believe emails about new product announcements and upcoming sales, especially when they include coupons, fall into this category.

Fewer participants ranked relevant products as having a strong influence at 32%, and 41% said it had somewhat of an influence.
Our qualitative study participants told us that once they choose to open an email, if it’s from a retailer or other ecommerce site, they want to see relevant products. However, we’ve already seen that the Click-to-Open Rate has been dropping for the last 3 years, which means, they may want to see these items, but they’re going to be even more selective in clicking on things. Recipients want:
Rather than attempting to include all your value props and story in an email, senders should focus on driving recipients back to their website. Once a recipient has come to your website, you have a lot more control over their experience, the offers and products they see, and how they finally purchase something.
Much like how the sender strongly influences the decision to open an email, the brand of the sender also has an influence on the recipients’ choice to click links within an email. Many recipients will see who’s sent them an email, open the message, and even if they don’t see anything in the message they like, they’ll click through to the site because they have an affinity for that brand and their products.

In addition to being one of the influencing factors in deciding to click email links, the brand of the sender can also cause frustration. Recipients particularly dislike when these emails do not come from a recognized sender. When that occurs, the emails seem suspicious and dishonest. This makes them feel like they are getting spam.
As an email sender, make sure you’re following address collection best practices so that your messages are only being sent to recipients who are familiar with your brand, and want to receive those messages.
Many senders spend a lot of energy thinking about how they can make the links in their email stand out, and we’ve all heard stories about changing the color of a button in order to drive more clicks. Unfortunately, the color, placement, and even the text of the link are all factors that recipients say have the least amount of influence.

Obviously, links are critical for any email, but rather than focusing on the perfect color of a button or call to action, senders should focus more on providing value in their messages, and having a call to action that stands out, that recipients can engage with.
While it’s nice to know what recipients prefer or enjoy about email messages, it’s equally important to understand what frustrates recipients about the email experience. Identifying these frustrations can help email senders improve their emails and sending habits so that recipients are more likely to engage with their emails, and less likely to unsubscribe.
Below, we look at a few different parts of the recipients’ email experience. We asked our study participants 3 questions:
Just about everyone has some type of email inbox. In 2018, The Radicati Group, Inc. estimated there were about 3.8 billion email users around the world, and that number is expected to grow to more than 4.2 billion by 2022.
Whether they’re checking it multiple times a day, or just once every day or two, they have a repository of email messages. The email experience can be frustrating for recipients, especially with the volume of email each person is receiving. We asked study participants to rank the following frustrations about the inbox for us:

Across all age groups, the three factors that recipients found to be most frustrating were:
This means that recipients are tired of getting so many emails in their inbox, especially from unknown senders. “Spam filters not accurate” indicates that recipients are frustrated when wanted email is sent to SPAM incorrectly. These three frustrations remain in the top when we look at age groups in both countries.

One interesting difference between the two countries is that unknown senders seem to be what frustrates people the most across all age groups in the U.K. at 56%. In the U.S., the three top frustrations are much closer. As a sender, this reiterates what we tell our customers: make sure you’re only sending email to people who are familiar with your brand and want to receive your messages.

Now that we know what’s frustrating recipients about their inboxes in general, we decided to dive a little deeper and learn about what frustrates them about the messages they receive and open. We asked study participants to choose their top three email turnoffs from the following list:

By far, the three biggest turn-offs for our study participants were:
Email recipients dislike irrelevant messages. For instance, sending an email about dog chew toys to cat owners will likely frustrate the recipient far more than drive engagement. Second to irrelevance is email from unknown brands or companies. Mail from unknown senders isn’t likely to be opened, and it adds to the rest of the messages in inboxes.
Lastly, grammar/spelling errors in emails is frustrating to recipients because it makes the message look suspect, and makes the brand look unprofessional. Make sure you’re always double-checking your messages so they’re typo-free!

Looking at differences between age groups and locations, Baby Boomers appear to be the most intolerant of irrelevant emails, with 84% in both countries ranking that as the biggest turn-off.
Email has been around for so long now, and recipients are so familiar with it, that they know what email should and should not look like. By pushing the boundaries and incorporating any and all new graphic design trends, you could be turning your recipients off instead of intriguing them.
Emojis didn’t rank very high in our quantitative survey, which could mean they still turn people off, just not as much as the top three. Our qualitative study participants, however, definitely had some opinions about them.
Of all the age groups, Gen X and Baby Boomers dislike seeing emojis the most, and suggest they’re annoying. They feel emojis are unprofessional, look childish, and often cheapen an email offering. This is especially true if the sender is a financial institution or one where trust is a cornerstone of a business relationship.
GenZ and Millennials tend to be more split when it comes to emojis. While several echo what the older generations say, some feel emojis do fit with certain brands that are fun and playful.
The bottom line is, as a sender, you should have a good read on your recipients and customers. If your customers tend to be a bit older, it may be worth skipping emojis in your subject lines. If you’re a younger company with a young client base, include them, but don’t go overboard.

As we saw above in our global benchmarks, the average number of messages sent each month increased in 2019 from 7 to 8.3 messages per month. This means that on average, email senders are messaging their recipients more than twice each week.
We wanted to learn if an increase in sending frequency would cause recipients to unsubscribe from an email list.

What’s interesting to note, 54% of all participants say that if a company were to increase their sending frequency to an email every day, it would be a significant factor in their choice to unsubscribe from that email list.
Receiving too many emails from the same sender over the course of a week is one of the biggest pet peeves reported in our recipient ethnography study. Their annoyance is compounded when a company bombards their inbox multiple times a day, or the offers they receive are all very similar, and the sender does not seem to have anything new to say.
Have a closer relationship with your recipients and know what they've bought in the past. If you have someone that bought a product they won't need to replace for a year or two, continuing to send them offers on that same product isn't going to drive another purchase. Think about other products they may want or need.
“Receiving an email every day is a nuisance...certainly every other day probably as well.”
While they say they appreciate emails that might benefit them in some way, such as those that promote a sales event or offer a discount for an online purchase, several say promotional emails can also be quite annoying.
Frequency was also important to several participants who were turned off when companies send too many emails in a short span of time, or when these emails look too similar and feel too repetitive.
“I would say not more than once a week, and I think once a week is pushing it.”
In general, the best way for an email sender to get recipients to open and engage with emails is to send them content and offers they want to receive. We’ve already seen that irrelevance is one of the most frustrating things about emails, so ensuring those emails are relevant to recipients should be at the top of the list for email senders to do.
One of the easiest ways to accomplish this is to simply ask recipients what type of email they’d like to receive. Oftentimes, companies only provide an email preference center when a recipient has decided to unsubscribe from their messages. Unfortunately, this isn’t when recipients want to give you their email preferences.
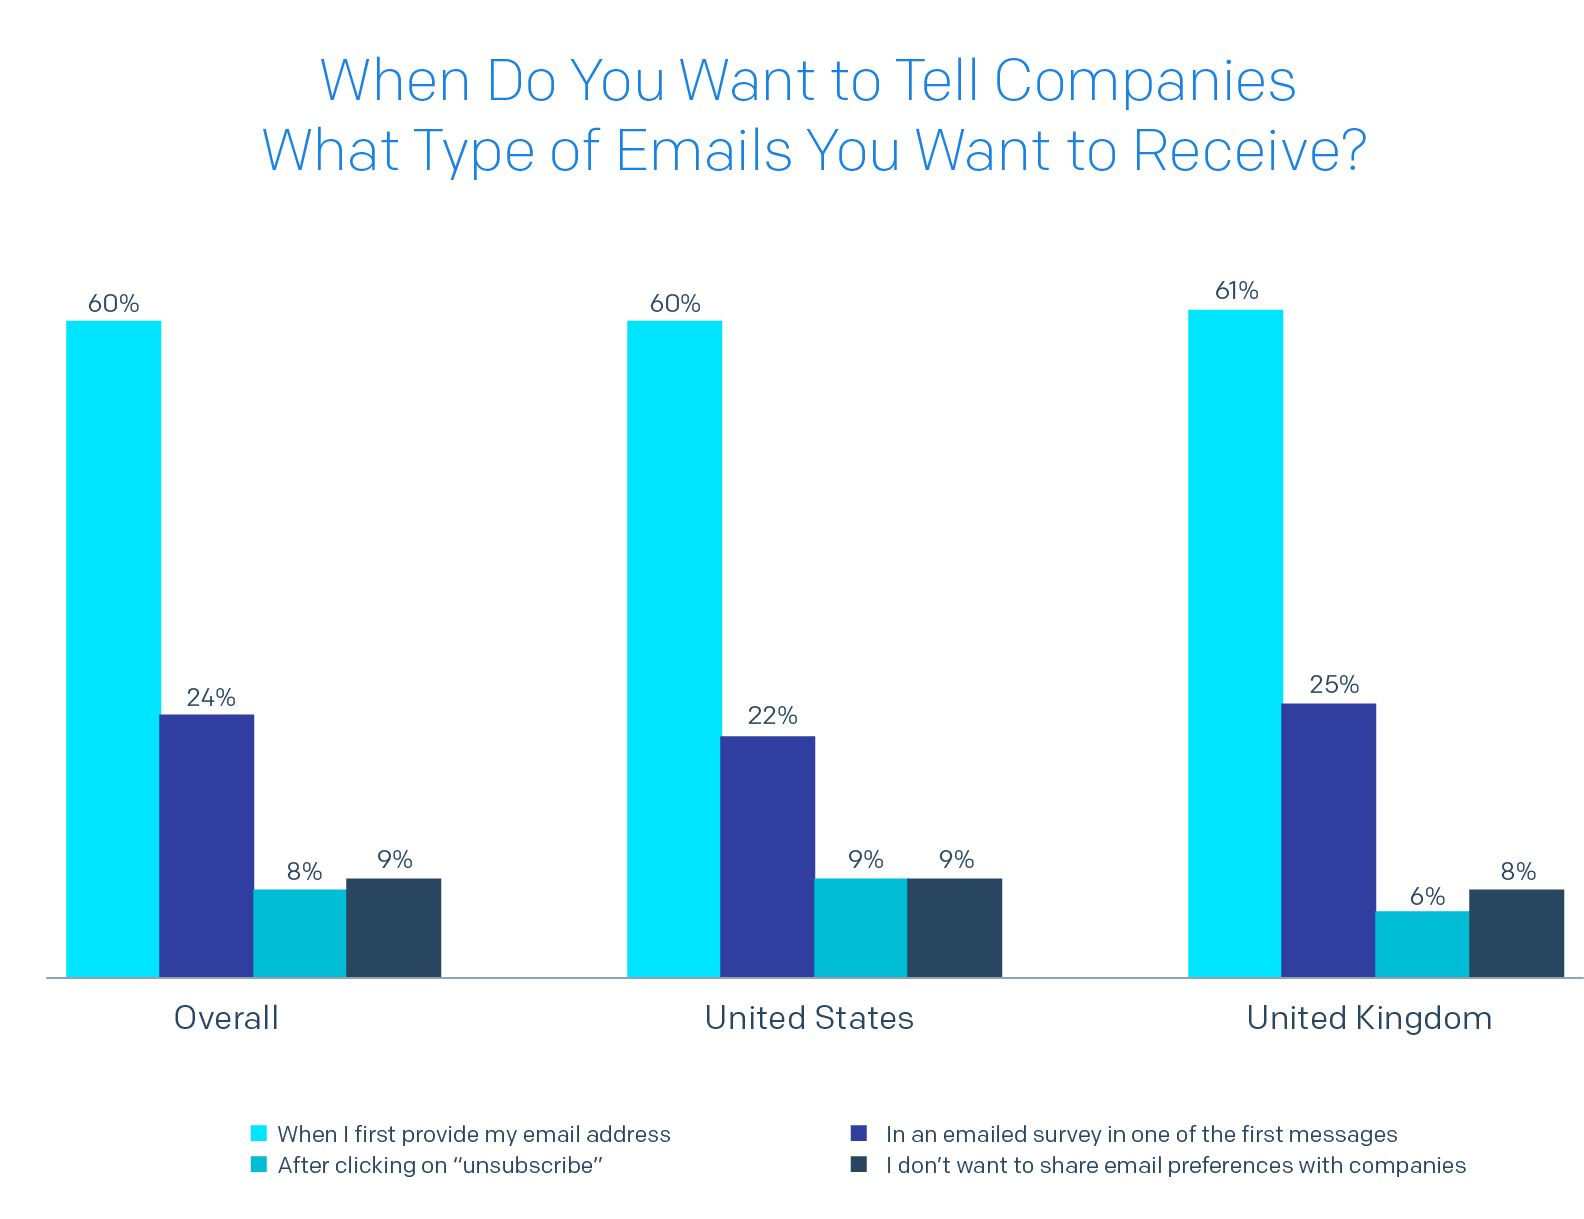
Overall, 60% of participants would prefer to tell companies exactly what kinds of email they’re interested in right when they provide their email address for the first time. An additional 24% of respondents said they’d be interested in a survey emailed to them soon after providing their address.
When we look at how these responses compare country to country, there are a couple of interesting things observed:

While the vast majority of participants still want to provide their email preferences when they first submit their email address, 13% of Baby Boomers across both countries said that they don’t want to share their email preferences.
“I wouldn't mind filling in a survey or a form online. I think it feels less creepy if it's done via a survey.”
For the most part, companies are eager to gain new email subscribers, but they’re not as interested in letting the subscriber determine what email they’ll receive. The email sender benefits if they include those sending preferences at the beginning of their relationship with the recipient.
When we interviewed participants for qualitative insights around this, we gained even more insights:
“It just shows consideration versus shoving stuff down your throat. They care about the customer more than pushing sales.”
When you don't collect email preferences at signup, you create more work for yourself by trying to figure out how much email is right for your recipients. In general, once a recipient has made the decision to unsubscribe, they're not interested in updating their preferences at that time.
You might think that older email recipients would have stronger, or different opinions than younger email recipients, but in general, that’s not what our research showed. The differences that stood out include:
Like the different age groups, there weren’t many differences between email recipients in the U.S. and those in the U.K. The areas we did see the largest differences include:
Ensure Correct Email Delivery and Placement – Incorrectly placed email, like when an expected email ends up in the spam folder, frustrates recipients. Learn more about improving your email deliverability in our Email Deliverability Guide.
Know Your Customers – Depending on the demographics of your customers they’re going to be more or less willing to engage with emails that have multiple images, videos, or GIFs. If your customer or user base is made up of mostly Baby Boomers, consider leaving those things out of your next campaign. Or better yet, segment your recipients and create emails that they’re more likely to appreciate upon opening.
Be More Selective – Senders should be more selective with the messages they choose to send recipients. In 2019, recipients are receiving more email than ever before, and companies are sending 8.3 messages per month. In order to stand out to recipients, senders should make sure they’re sending messages recipients are interested in and will value.
Make Sure Your Messages are Valuable – Recipients are more selective on what they will click than ever before. Even though the open rate dropped to 14.5%, the click to open rate also continued its drop. This means recipients are likely to open an email, but less likely to click on anything. Try to provide recipients with valuable messages that they want to receive.
Experiment With Frequency – Senders should continue to experiment with their sending frequency. Rather than sending many emails to all of their recipients, try sending fewer messages to more targeted groups to see if your engagement improves.
Optimize for All Countries – Make sure your email is optimized for inbox providers across the world. Email is one of the most commonly used communication channels in the world. Make sure your messages are getting delivered correctly by properly authenticating your messages.
Don’t Worry About When to Send – Email is a part of life for nearly everyone, and people with email addresses are typically checking their inboxes multiple times a day. This means that things like the time of day they received their messages are less important than ensuring the content of the message is valuable to each recipient you’re sending to.
Including Emojis – While it may spice things up a bit, including an emoji isn’t always worth it. Depending on the age of your customers, emojis may come across as unprofessional or spammy, and not as playful and interesting as you may think.
Content is Important – Many email senders think that there’s going to be some silver bullet they can add to their program, or use in a subject line that will unlock a lot of clicks. This isn’t the case. The one thing senders should think about is providing their recipients with messages they want. Think about segmenting your list and sending more targeted messages to groups of people with specific products or offers that they’ll want to receive.
Keep it Simple – Email recipients have been using email every day for a long time now, so they’re very aware of what an email should and should not look like. Rather than trying gimmicky things like flashy GIFs and videos, multiple images, or super long newsletters, you’re better off providing a well-designed email with a few sentences of content and a couple of images that illustrate your offer.
Double-Check Your Work – Grammar and spelling mistakes were some of the biggest turn-offs when it comes to email. Make sure your emails are error-free before hitting the send button.
Now that you have the data and findings from our research, what should you do next? Below are some tips that we’ve compiled on what you should and should not send to your recipients. Scroll through for a thorough list of things to send (and what to avoid).

Aggregate Open and Click Rate: These are percentages of all unique messages sent by a segment that were opened or clicked. Messages that are clicked or opened more than once are not double counted.
Aggregate Delivery Rate: Percentage of all messages sent to valid addresses that were not rejected by the inbox provider.
Aggregate Spam Rate: The percentage of all unique messages that were marked as spam.
Mobile Ratios: Using the recipient device information inferred using the method described above, devices were categorized as mobile or not mobile. These ratios are the distinct count of mobile/non-mobile devices seen divided by the total distinct count of devices seen. Each device is counted only once per recipient.
Aggregate Monthly Send Rate (Send Frequency): This is the number of unique messages on a per sender per recipient basis. It tells you how many messages an average recipient might see from an average sender in a particular segment.
Aggregate Click-to-Open Rate: This is the ratio of unique clicks to unique opens; duplicates are not counted. This answers the question: “Of the emails that were opened, what percentage were clicked?” It can be thought of as a proxy for content quality.
The recipient engagement study was performed by InterQ Research.

SendGrid helps you focus on your business without the cost and complexity of owning and maintaining an email infrastructure. And with a full-featured marketing email service that offers a flexible workflow, powerful list segmentation, and actionable analytics, all of your email needs are met in one simple platform.